My favorite time of the year is Fall, I am fairly certain I start each Quarter 3 newsletter off with something along those lines. The weather is perfect, the smell of the forest floor after the first few rains in the Santa Cruz Mountains is something I look forward to each year. This past week is a great example, a humid rain storm followed by mid 70’s along the coast. A great reminder as to why we all choose to live here. This is a photo of Shiloh on our morning walk in Soquel.
A lot to talk about in this newsletter as it turns out we had a solid pulse on the market back in June when writing our 2025 Quarter 2 Newsletter. As always if you are limited on time, please see our AI summary below.
AI Summary Link HERE.
-
Supply Levels
-
Interest Rates
-
Commercial Real Estate Update
-
Update to Local Closing Costs
Supply Levels
After an incredible start to the year, uncertainty around the new Presidential Administration and their Liberation Day announcement felt like cold water being dumped on what first appeared to be a great new year from an inventory perspective. For those who have been following along, we have been dealing with the Lock-In effect as inventory levels remain lackluster with the rise in mortgage rates post covid. With 70% of homeowners having existing mortgage rates below 5% there continues to be a lack of motivation for those homeowners to give up that low rate for a new home, even if that new home better meets their current needs.
I often refer to the quote, “A confused mind always says no.” This applies to the last few months as many homeowners and potential buyers chose to focus on their summer plans over their real estate goals. We saw this in the seasonal decline of inventory noted below as well as the total number of sales which fell 3% when compared to Q3 2024.
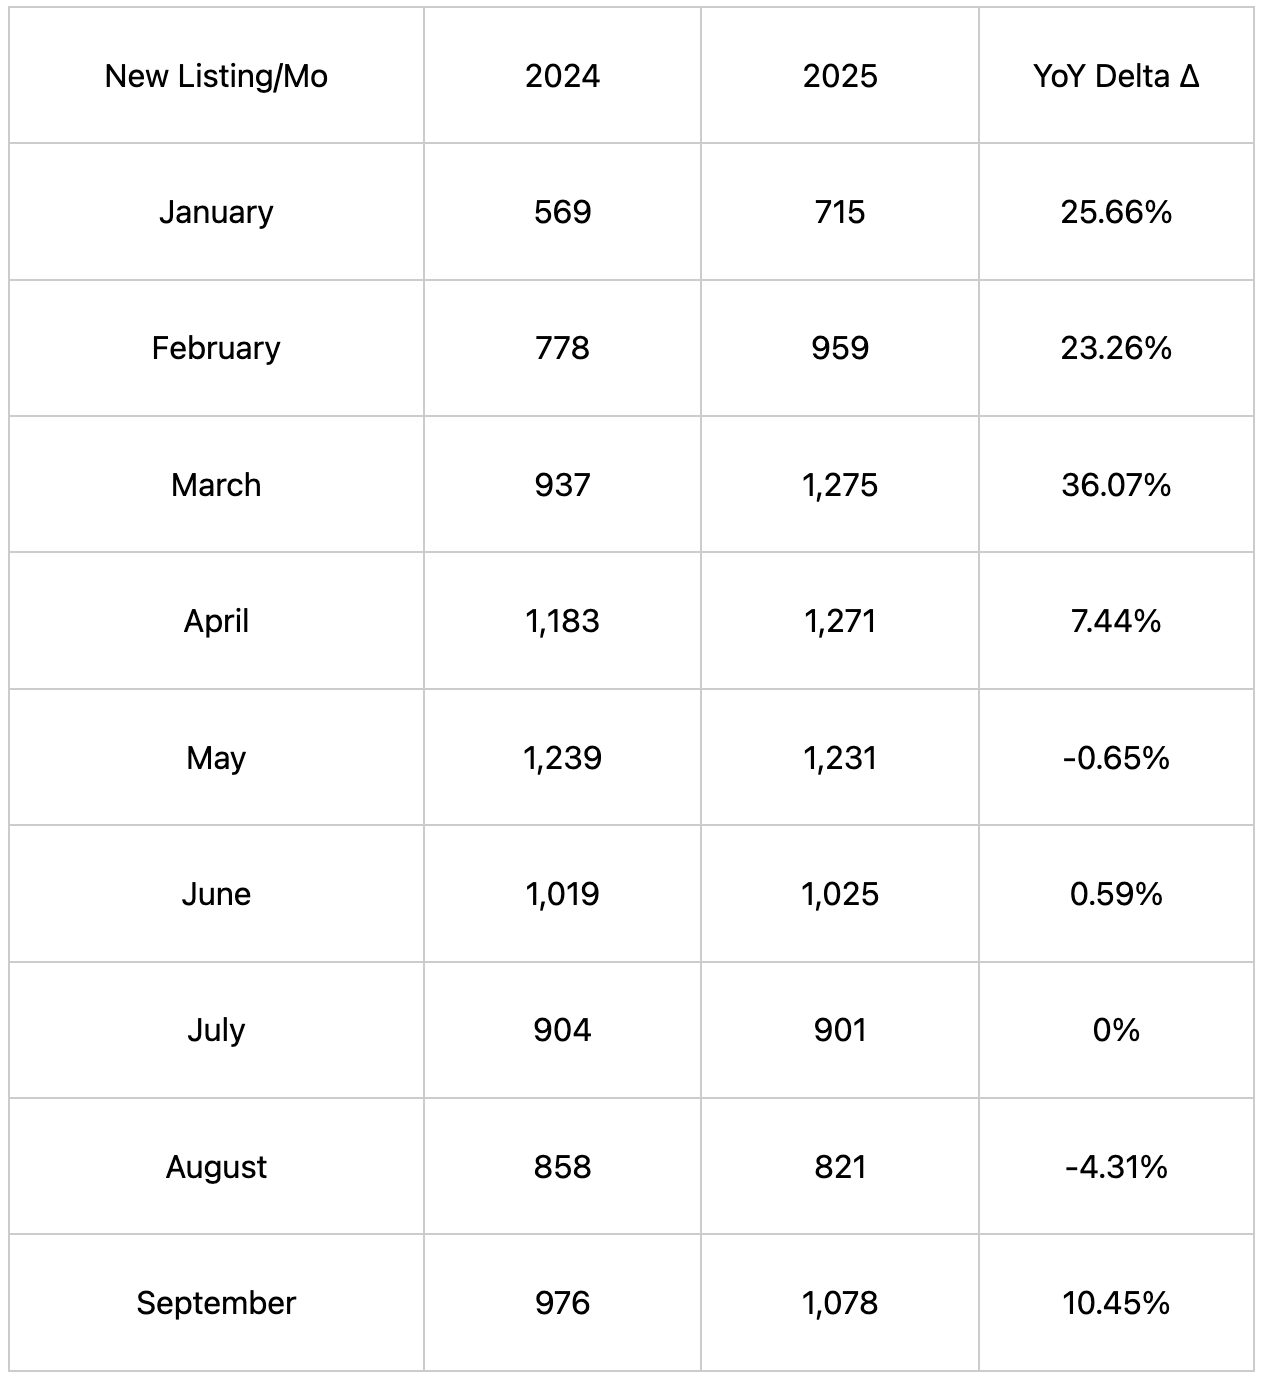
*MLS data provided | Single Family Homes | Santa Clara County
However, we have remained optimistic about this fall as it became evident over summer in conversations across both our clients and with colleagues, that there was considerable pent up seller demand and that inventory would increase. You’ll notice this has started to come to fruition with the post labor day surge in new listings for September. We anticipate this trend of modest growth in supply through at least October. Sellers will need assurance that buyers are engaged in order for that trend to continue.
One interesting trend we noticed the last few years is that we’re finding more buyers choosing to prioritize their home search in Quarter 4. This is in contrast to what many long time industry professionals would consider a seasonal lull. I have found that with larger companies offering extended time off, and often lighter workloads, this time of year becomes ideal for many career oriented professionals. By choosing to use this time to prioritize their real estate goals, we often see sustained buyer engagement through the holidays. However, they are usually met with lower inventory levels as many sellers under the guidance of their agent, wait to list until the turn of the year or even spring. As a result prices have actually stabilized in Q4 whereas in years prior we saw not only a decrease in the number of sales but also in sales price. Something to pay attention to if you are considering selling in the first part of 2025 as it may be worthwhile to consider a soft launch in Q4 to see if you can obtain your price target.
As for median sale prices amongst single family homes in Santa Clara County, we have yet to see any downward trends when compared to 2024. I expect to see this appreciation continue as mortgage rates show buyers some relief.
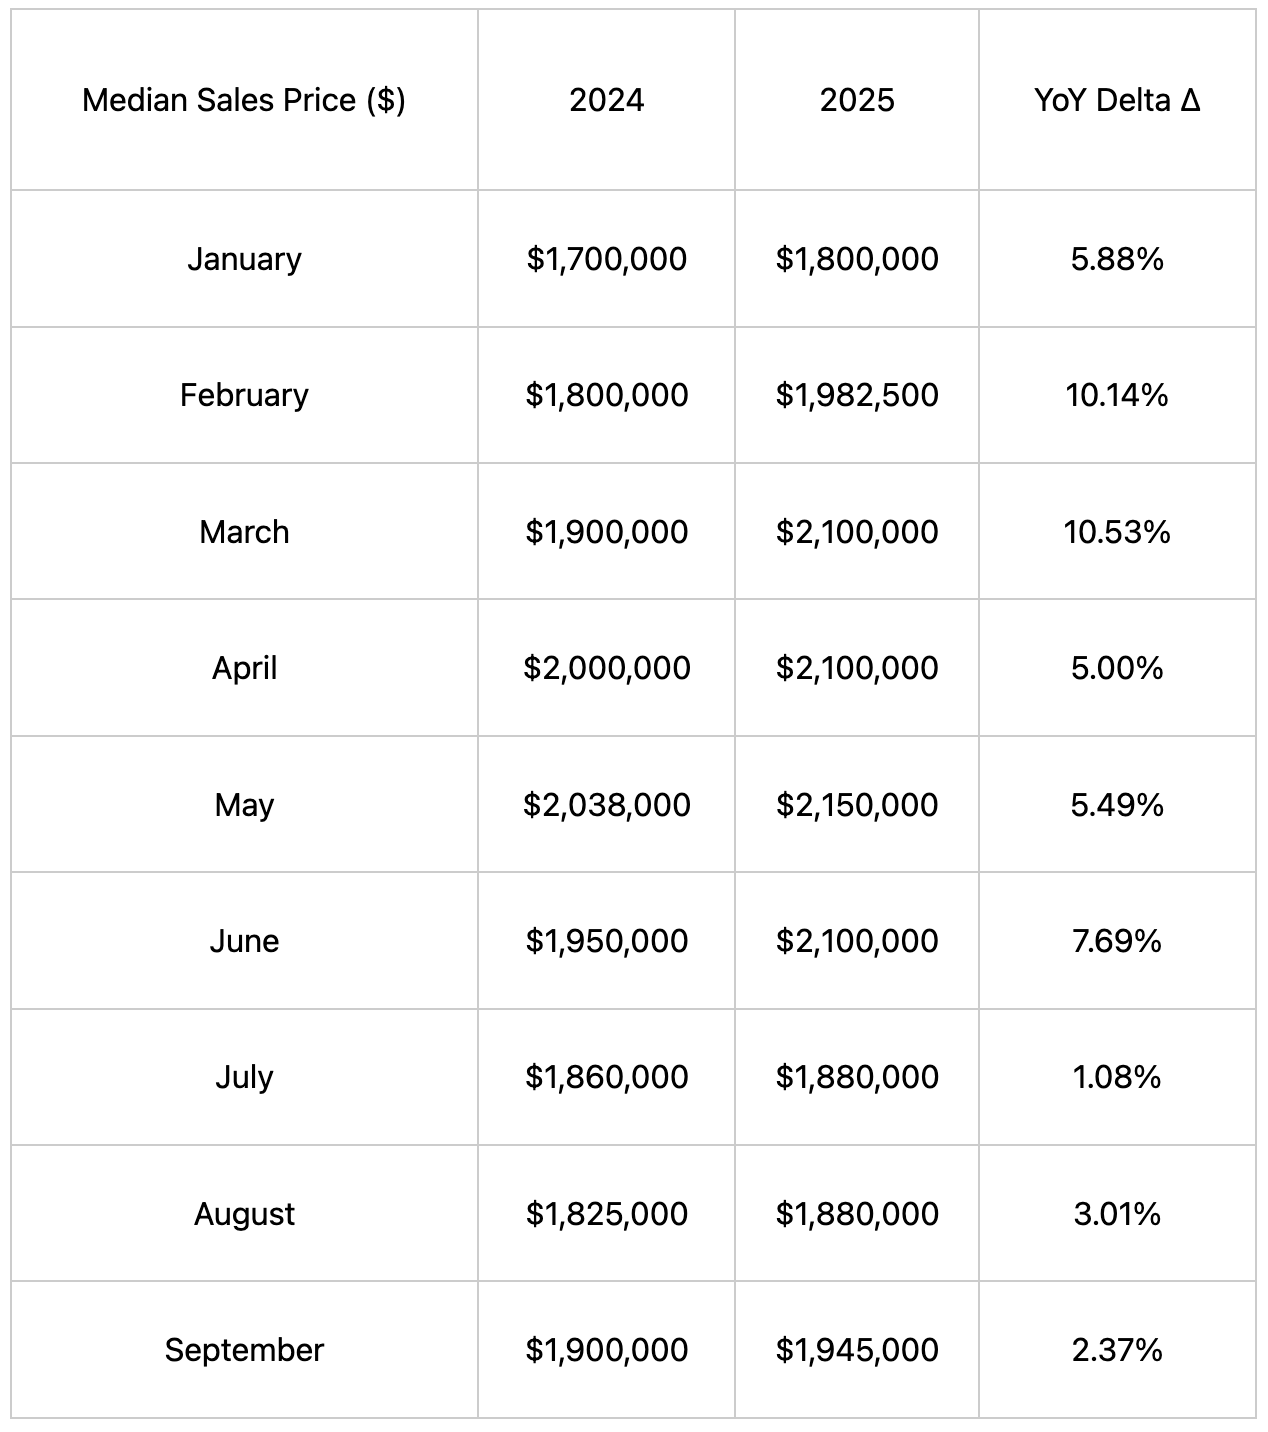
*MLS data provided | Single Family Homes | Santa Clara County
Interest Rates
The Federal Reserve resumed its rate-cutting cycle in September with a widely anticipated 25 basis point reduction. This decision was primarily driven by cooling inflation data and concerns regarding the labor market. However, similar to last year's 50 basis point cut in September, the 10-year treasury yield increased, consequently lifting mortgage rates. This serves as another reminder that the Fed primarily influences the short end of the curve. Keep in mind the bond market had already factored in a few additional cuts before year end. So unless there is a deviation most of the upcoming cuts at the FED level are already factored in to the 10 year treasury.
Since the announcement, rates have settled back to their pre-cut levels, which is excellent news for borrowers as rates are now at annual lows. As of this newsletter, a standard 30-year fixed-rate loan is at 6.3%. However, I strongly advise connecting with a preferred lender, as we've seen clients secure 30-year fixed loans below 6% recently.
Mortgage applications have remained steady, indicating resilience despite waning consumer confidence. A notable exception is refinances, which surged by nearly 60% in the first few weeks of September as new homeowners sought relief from their recent purchase loans.
During a recent office meeting, an agent inquired about the market's potential reaction if mortgage rates were to fall to 4-5%. I took the opportunity to explain the mechanics of the 10-year treasury and why, at least in the short term, a significant drop in mortgage rates would likely signal negative news for the real estate market. Although the accompanying graph refers to the front end of the curve, its principles apply to the overall mechanics of bonds as well.
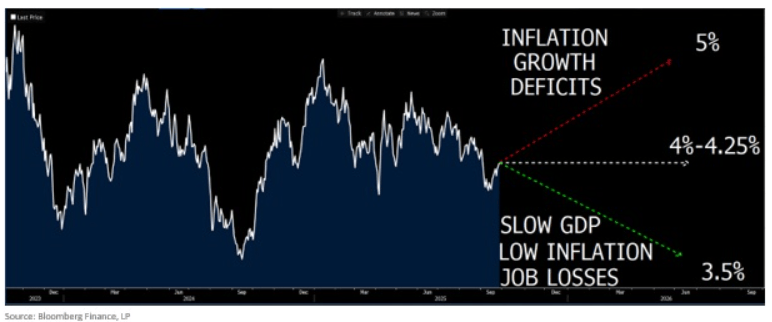
In order for mortgage rates to fall considerably from where they are now, we would need to see the wheels fall off. Which I don’t think anyone wants to see happen. As of now, GDP prints have been stellar with Q2 at 3.8% and despite the tariff policy inflation seems to be moving in the right direction but is still above the Fed target of 2%. Where we may start to see cracks is with the unemployment rate. Job growth has already shown weakness but unemployment has remained stable. If that changes, mortgage rates may come down enough to motivate some sellers to consider a change but then the questions will be around buyer demand.
In summary, I don’t think a dramatic shift in mortgage rates is the answer to our problems, as I personally believe we’d then be in recession territory.
Changes to Local Closing Costs
Measure E in San Jose and Measure B &C (competing measures) in Santa Cruz are some of the most recent local moves to fund affordable housing by increasing the costs of selling real estate. This segment highlights these taxes and what to look for on your closing statement.
Measure E was passed in March of 2020 by voters and is often referred to as the “Luxury Tax.” It is a real estate transfer tax applied when certain property transfers in San Jose exceed a threshold, this tax is above and beyond the existing city transfer tax of $3.30 per $1,000. The original threshold was $2,000,000 for Measure E but as of July 1st 2025 the threshold is now $2,300,000. Meaning that until a sales price reaches this threshold, the Measure E Tax does not apply. However, when triggered, Measure E is tiered and applies to the full sale price at these rates: 0.75% from $2.3M to $5M, 1.0% from $5M to $10M, and 1.5% above $10M.
Taking a page out of San Jose’s play book, the city of Santa Cruz will be voting on a similar measure come November.
Measure C: Workforce Housing Affordability Act of 2025
-
Transfer tax on the portion of price above $1.8M, tiered as follows:
0.5% over $1.8M to <$2.5M, 1.0% over $2.5M to <$3.5M, 1.5% over $3.5M to <$4.5M, 2.0% over $4.5M, capped at $200,000. -
Thresholds and cap adjust annually by CPI.
-
Parcel tax $96 per parcel per year.
-
20-year term
-
Estimated $1.5 million from parcel tax and an additional $1 million from transfer taxes collected on sales over $1.8 million.
Measure B: Workforce Housing and Climate Protection Act of 2025
-
Transfer tax of 0.5% on the portion of price above $4.0M.
-
Threshold indexed annually by CPI, up to 3%.
-
Parcel tax $50 per parcel per year.
-
10-year term.
-
Estimated $650k from parcel tax and an additional $150k from transfer taxes collected on sales over $4 million.
-
There is an exemption for those above the age of 55
If either measure passes, the new city transfer tax would be in addition to the county transfer tax of $1.10 per $1,000 and any existing city-level charges. The structure is similar to how San Jose layers Measure E on top of county and city transfer taxes.
Commercial Real Estate Update
I wanted to circle back and touch on the commercial real estate (CRE) sector from previous newsletters as we are still looking at a looming maturity wall. As of October 2025, total outstanding CRE debt hovers between $4.8 trillion and $5.9 trillion, with a significant $957 billion to $1 trillion in loans maturing this year—nearly triple historical averages. This "maturity wall" is exacerbating distress, particularly in offices, where record vacancies (around 19-20%) and remote work trends have driven property values down 20-40% since 2022. Multifamily and retail segments show more resilience, but overall, new lending has rebounded modestly by 13% year-over-year, supported by Federal Reserve rate cuts.
Delinquency rates have climbed and foreclosures are still expected to surge in late 2025 and 2026, driven by maturity defaults, though lenders' "extend and pretend" strategies, loan extensions and modifications may delay the peak. Distressed assets totaled $116 billion in Q1 2025, up 31% year-over-year, attracting opportunistic investors. While nothing even close to a 2008-style crisis, 278 regional banks with heavy CRE exposure (holding ~$3 trillion) remain vulnerable if economic growth falters.
CRE loan rates average around 5.11% as of October 1, down from earlier highs, influenced by the Fed's recent cuts. Compared to residential mortgages (mid-6% range), CRE rates are more sensitive to Fed actions due to shorter terms (5-10 years) and floating-rate structures (~40% of loans tied to SOFR). However, fixed-rate CRE loans align closely with the 10-year Treasury yield (currently T10 ~4.115%), which has eased to support valuations and cap rates. This dual influence makes CRE more volatile than residential, where fixed rates dominate and provide insulation. Overall, the sector is adjusting gradually, not collapsing, but risks persist.
Thank you for reading our newsletter. If you are interested in learning more about a specific neighborhood or market, please reach out to us. We’d love to help.